Natural limits and bad weather
So in the previous post someone asked me to post my spreadsheet for one of the pictures I posted. To be honest, I cooked it up really quick, and I think I nuked it at the end, so I had to make one from scratch again. This time however I had some fresh data from a LS2 with the Maximum VE tables upped into a reasonable territory. The problem with this data was that it was taken a day after the horrible tornados that went through The South recently, so maximum MAP for example was about 96kPa, while I've seen over 102kPa on this car before, so I know it's the weather, not a physical limitation of the car.
Also, since I've started dealing with LS2's, few limits became apparent: first it was the IFR table, then it was the GMVE, now it's the extra low airflow and airmass limits that I wrote about few days ago. All these limits got me thinking on what are the real limits of the stock computer. Afterall, with 63.95lb/hr of fuel I knew we'd run out of ability to describe fuel delivery, and 4.096 K*g/kPa on the GMVE table would limit the amount of airmass and airflow we could report.
Put all these things together, and I ended up with two spreadsheets: first, the correct version of what I created for the last writeup (yes, it was wrong! I'll correct it later), and a spreadsheet where I can convert gathered data into a much more comparable airflow and airmass figures, corrected to SAE conditions (99kPa, 25*C).
I'll start with explaining what I've done before and how it's all better now.
I took the Maximum VE values, and converted them to airmass, and then airflow values.
This shows that at extreme conditions of 188F IAT (why I picked these, I'll explain bit later) we'd get about 280g/sec of airflow at 6400rpm, which is also the limit expressed in other tables, so they make sense all together.
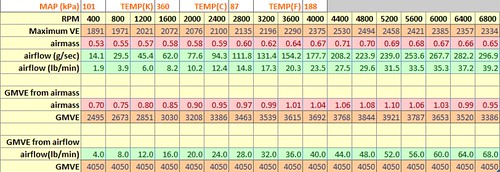
For exploratory purposes, I also added 2 'reverse' scenarios, for the pupose of seeing what kind of GMVE values one would get to achieve a certain airmass (or airflow in the second case).
Notice that with near max'ed out GMVE numbers, we'd get about 68lb/min airflow. If that sounds familiar, that's because it is. MAF's maximum number is 512g/sec which is the same damn limit. So this means, GM made the expressive powers of both VE and MAF tables equivallent, even for the worst conditions, which is the proper OEM thinking, always engineering for the worst possible scenario. So this means that no matter whether we use SD or MAF tuning, the limits are going to be the same.
The middle section (GMVE from airmass) was made becuase I wanted to see what valued I should expect from a well flowing big cam/heads setup, as I've seen some put down over 1.05g/cyl airmass. It's not exactly crucial, but it helps the total understanding.
Then I wanted to see how the numbers would change, if we made the aircharge temperatures slightly more optimistic, let's say about 80F (27C for these living in countries with a sane unit system), and I got these:
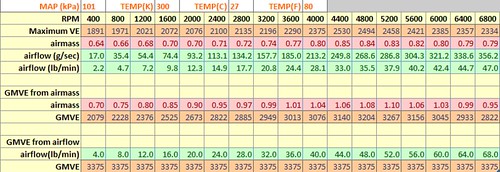
Turns out, that when temperatures are sane, we can get the same airflow as before, well below the GMVE table's limit! This is where a big bulb went off over my head. The reason why we've had so much problems with VE tuning in LS2, is becuase GMVE, while generally proportional to the old fashioned VE we're used to from LS1 computers, also reacts to pressure and temperatures! This means, unless we normalize pressures and temperatures while SD tuning, resulting GMVE are going to vary with the atmospheric conditions!
Yes, these statements require exlamation marks. In LS1 world, VE was nice to have, because it was temperature and pressure invariant. Here, we dont have this comfort anymore. OOPS, no wonder LS2's didn't want to easily converge on a stable GMVE table!
Good luck for my research, and bad luck for Alabama and Georgia, tornados hit them hard lately, and I just happened to send one guy who lives there to a dyno, to see what our recent extensive SD tuning managed to achieve. He wasn't happy, because the numbers were down from previous hacks performed by various pseudo tuners. So partially to cheer him up, and partially to find out just how much power can bad weather 'steal' from a car, I started some more number crunching.
Because these were dyno runs, I displayed all kinds of data against RPM. Temperatures, airmass, airflow, pressures, all got dumped into a table, as I didn't quite know yet what I'm going to need. Also because I wanted to get as close of numbers as possible, I grabbed data from the ECT vs IAT bias table. For these who havent played with it, it's a table that based on how fast the air is moving in the intake (airflow), the temperature used to calculate airmass (and thus airflow) would be weighted by different amount for IAT and ECT.
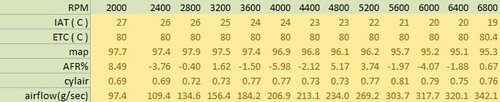
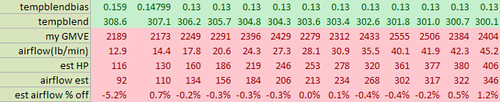
So first I calculated the temperature bias based on airflow and the temperatures. From that I was able to get the temperature that the computer (hopefully) uses to calculate other stuff.
Having that temperature, I was able to backcalculate GMVE values that gathered airmass figures would yield. To verify the correctness of my simulation, I calculated airflow using my new GMVE values, to compare against the airflow gathered directly from the computer. Error through the whole range is less than 0.7% in all cells except the edge ones, which is understandable, as we're using averages values, and on the edges we dont have data gathered from the entire range (ie. we're using 6800rpm to calculate airflow in that cell, but the data gathered from it would be calculcated from 6600-6800, so the average should be more like 6700). Either way, I can live with 0.7% error in my simulation.
With the GMVEs calculated for these particular conditions, I decided to see what the airflow and airmass would be like in SAE conditions. Low and behold, they would go up, quite significanly too. 2.5lb/min at peak airflow and 0.04g/cyl at peak airmass extra. I've been using a metric of 9hp per each 1lb/min of airflow for ballpark estimation, as it usually creates reasonable numbers, useful for more 'common sense' comparisons. So in the case of this car, we'd get 24hp correction.
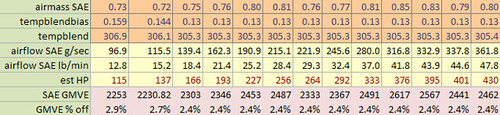
Then I decided to yet again, calculate GMVE for the corrected airflow, to see how it would look like at these SAE conditions, and how far off it was from what we had, hoping we would see a correspondence to the AFR%Error logged.
Almost all new GMVE values ended up being about %2.4 off from what we calculated earlier. AFR%Errors are much more varied in both magnitude and direction of the correction. So that's not what cause these AFR swings. Where it really came from will be a whole different study.
Ok, so this was a lot of stuff... What's the point, what's the punchline here?
We cannot tune GMVE the same way we used for VE. I dont know how the hell I missed it the first time around, but that's what you get for theoretical tuning. You guys really oughtta buy me a GTO--Please paypal all your donations to marcinpohl at gmail dotcom ;)
Joking aside, but this is going to need another tool/spreadsheet/customPIDs or something creative like this. The new way of doing LS2 VE table is going to need taking into consideration not only current VE table and AFR%Error (or BEN's for EFILive folk), but also temperature and pressure. We will effectivelly have to convert the GMVE into VE, apply the correction there, and then convert it back to GMVE based on some conditions that the computer has to assume as standard values.
I will definitely make a tool for it, but not now, I really really oughtta get back to my thesis right about now.
MaximumVE spreadsheet DOWNLOAD
Bad weather correction DOWLOAD
posted by Marcin @ 4:18 PM
1 comments
![]()
![]()