Under (Fuel) Pressure
After a year and a half of using the IFR spreadsheet, I came to the conclusion that while it is not wrong as far as the information given, it leaves much to be desired when it comes to truly reflecting reality. The biggest problem it has is the lack of expressing how fuel pressure differs at various loads (Manifold Vacuum).
Unexplainably high VE values on some cars made me think that even though we 'fixed' some old-school arbitrary IFR choices, we're still fudging somewhere, because there's no reason for the theoretical VE numbers to be that high.
Once I created the equations for airflow I realized that the only spot where the 'fudge factor' could occur would be the IFR. The rest of terms in the eqations is either logged (MAP, temps, RPM) or not exactly changable (number of cylinders, cylinder displacement). In the meantime, TAQuickness and few others started working on a simple setup that would allow us to log fuel pressure alongside all the usual PIDs, not just a simple gauge you can look at at idle.
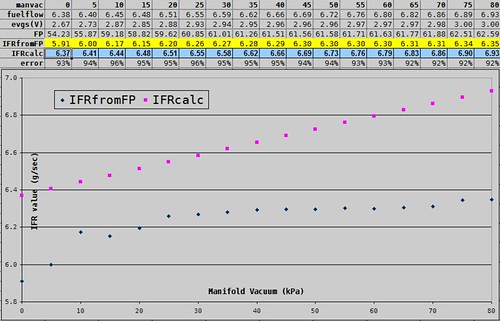
Eventually all the experiments came together, and provided me with some very interesting data. The car from which the logs discussed here come from is running 42lb/hr@3bar injectors running at 63psi. On the table and chart below, the values calculated using the standard IFR spreadsheet are labled IFRcalc (pink dots, values on blue background). The other data series is calculated from logged Fuel Pressure (comes in as a EGR voltage, so it's evgs in the table) which then gets converted to PSI for easy lookup/calculations (marked FP).
Once we know the nominal flow of the injectors and the real Fuel Pressure, we can calculate the real flow of injectors (labeled IFRfromFP, blue dots, yellow background in the table)
As you can see, the blue dots are nowhere near pink dots. Apparently measuring the fuel pressure at idle (no load) doesn't give you the best numbers. That's fine, that means you just need to reconfigure IFR for new FP, right? Wrong!
Not only the FP numbers going in aren't close to what they are, they are also non-linear. We need to update the IFR spreadsheet to be able to take various FP inputs, depending on the MAP. Easy enough I think, and quickly make some adjustments to the spreadsheets.
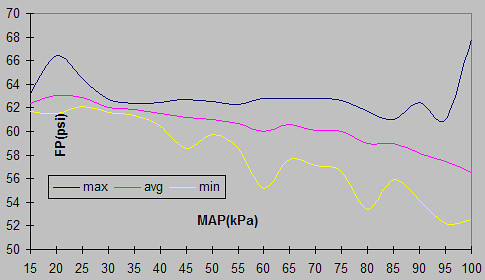
The Fuel Pressure drop seemed significant enough that I wanted to understand it deeper, it didn't just seem to be some underpowered aftermarket junk part, but a more complex issue. I wasn't quite convinced that the Fuel Pressure drop was solely a function of MAP/Manifold Vacuum. So I started graphing FP against various entities to get a better feel for it.
There was an obvious relationship between MAP/Manifold Vacuum and FP, as we already have seen with the data above.
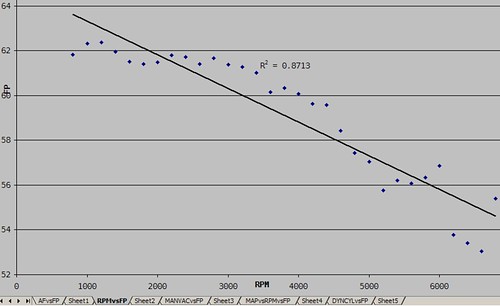
I graph it against RPM, and there's another definite relationship. Now I'm confused--how can it be, if the crucial IFR table is purely manifold pressure based?
Another popular view is airmass based, like the timing tables, I thought, maybe it's load/compression/torque dependent, afterall that's when the most air gets consumed.
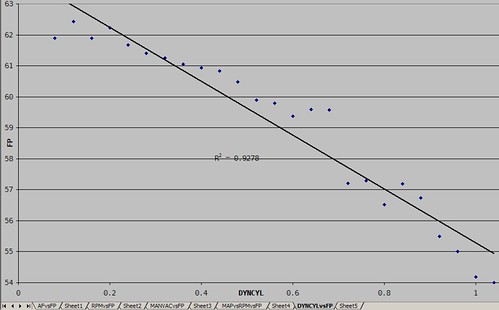
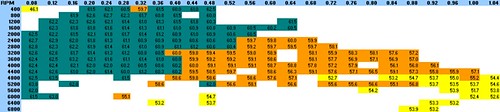
I graph FP vs DynCylAir and I keep getting the same shape drop when I did when I graphed it against RPM. Why not do a 3D graph of FP vs RPM and DynCylAir? I'm starting to see a cleaner relationship, the more DynCylAir coupled with RPM the less FP we get.
So I'm thinking: DynCylAir is like torque, and DynAir is like horsepower, and TQ and HP are bound through RPM, so why not graph DynAir vs FP?
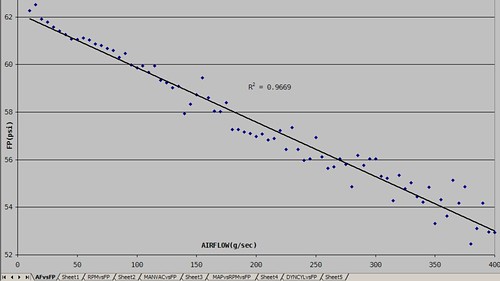
BINGO! This graph seems to be very linear, with a high degree of confidence.
But then I start to think what does this mean--why higher Airflow makes the Fuel Pressure drop so consistently linear? Obvieously more airflow needs more fuel flow, they're coupled through the AFR, RPM just enforces the time intervals to do the fuel injection in, and IFR tailors it to the injector size and fuel pressure.
From the Speed Density paper I've discovered that:
AIRFLOW=CYL*RPM*IPW*AFR*IFR/120
and we know that
IFR=IFR(rated)*sqrt(FP/FP(rated))
which for the purpose of this discussion(meaning keeping everything else constant) means that Airflow is directly proportional to RPM, and the square root of Fuel Pressure. This is not what this graph says, at least with the given precision. This graph, even though introduces a lot more noise for the high Airflow values, still seems to lay along a straight line. So the possible explanation might be that because we're using a fairly small range of FP values, we don't get see the curve that would result from a square root relationship.
Another explanation comes from the way I obtained the data for the Airflow vs FP graph itself; I histogrammed the Airflow into 5g/sec bins, to equalize the number of samples along the axis, because it's hard to log large number of samples in higher airflow ranges on the street. If I fit a line to a large number of samples, mostly in the lower ranges, the fit would be good there, but the scarse upper range data would be largely ignored. While the histogramming first gets rid of the weighing to the large number of samples problems, it potentially loses a lot of precision, in our case enough to not be able to tell which type of relationship it is.
So this investigation leaves us with more questions than answers:
- Why does the FP drops so much more than it officially supposed to (proportional only to MAP)
- If the FP is so well proportioned to Airflow, is that by design or by accident?
- Even if I log FP precisely for my fuel system and adjust IFR values directly based on that, the swings if FP values within the same MAP range (since that's all we can differenciate by in the IFR table), are still significant.
The only table that's able to account for the RPM swings is VE. This is not what I wanted to achive here, I wanted to free the VE table to be the 'catch all fudge table' and have it become the true theoretical Volumetric Efficiency. So where else could I move the fudging duty to?
This investigation started really small, I just wanted to see how badly does the Fuel Pressure drop and what effect it has on the IFR. Now I see the shortcomings of the fuel systems, computer's inability to express all the changes that take place, and shortcomings of my own IFR spreadsheet (new version coming up shortly).
There will definitely be a lot of other stuff coming out of these observations, as this is very scary, considering how much trust we put in aftermarket pumps, and they simply fall short of expectations. I've always told people to get bigger injectors and run with a healthy margin left. Apparently I didn't know just how right I was--in this case running with IFR falling 10psi from what your computer knows about yields 9% less fuel delivered! When you're trying to get your AFR within 1-2%, 9% error in one of your data is going to seriously monkey wrench your system.
So this xmas, be afraid, be very afraid...

New IFR spreadsheet, and then automatic translation of your VE based on the new IFR are going to be the next targets of attack for me toolwise.
Stay tuned,
Marcin
Stay tuned,
Marcin
posted by Marcin @ 4:34 PM
0 comments
![]()
![]()


0 Comments:
Post a Comment
<< Home