Roadracing logs analysis
So Dennis went racing to Summit Point and brought me some logs. For the underinformed crowd, this is a full fledged, although home made Camaro race car. Less than 2900lbs with fuel and driver, probably upwards of 420rwhp, huge wheels with roadracing slicks, aero, the works, you get the idea. He said that last time he was out, only one car was able to pass him, out of 50 or so at the track. NICE!
We've been tuning this thing for a while using EFILive and the blackbox logging capability and it's been coming along nicely. Dennis is happy with the power because he has no traction in 2nd gear if he floors it, even with the big slicks on. But on the roadcourse, 2nd is rarely used, so all this power should come in very useful.
So this is my newbie attempt at hacking the data into somewhat readable and hopefully educational graphs.
First I wanted to see if the car is healthy, and if it does what it supposed to do, so I checked injectors: pulse width never went past 12 and duty cycle never went past 60%, so I'm going to skip these boring graphs.
Next is Air Fuel Ratio when going partial throttle and full blast.
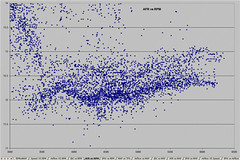
It looks reasonable, car goes into PE mode as MAP/RPM values increase, as these are the PE triggers.
What made me a bit curious though is why was the spread of AFR at WOT so large:
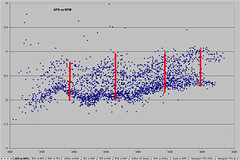
I thought to myself, maybe I'm looking at the wrong thing, throttle is just the input, intake manifold pressure (MAP) is the effective dictator of what amount of air is going to get pushed in, as well as it's used in Speed Density airflow calculations. So I graphed it another way to see if there is a difference:
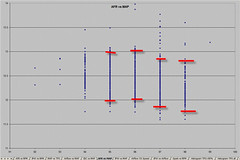
I dont see any frankly. we still get 0.7 to 1.0 point spread in AFR final values. I started to wonder what could be the culprit behind it. From experience, I know that a lot of information is to be extracted from plotting raw MAF signals and look at the noise levels, as an indicator of trouble. Here's what I came up with:
Damn it Dennis, clean your air filter! :)
The areas circled are noise, the signal has a very strong signature and range, but this is more than usual amount of noise. So if you ever see anything like this, go shake off dust, chunks of rubber from tires of cars in front of you, dead birds, whatever you got in there. Here we're gonna let him get away, as this log was the last one of all the sessions so stuff probably accumulated over the course of 2 days.
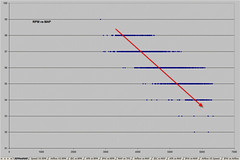
I did notice one more thing: maximum pressure in the intake dropped as the RPMs increased. Does this mean that we cannot feed air into the engine fast enough? Is this a sign of a bottleneck? Is it the intake manifold? Or is a just the overlap of the cam letting some air in and out fast enough that it shows up as never quite reaching the peak pressure values? Take a look:
Ok, so with all the checkups of the stuff that might make the car blow up (there's another boring graph or timing but that's really dead on the money), we started talking about more unscientific, but definitely tangible aspects of tuning. This track has a long straight, on which you could really scream through 4th (3.42 gear M6) up to 6500rpm, or try to shift a bit early to a not so dramatic 4400 rpm in 5th. But apparently, at 4400rpm in 5th, combination of greatly increased air resistance and falling off the powerband(cammed LS1 are the VTEC of pushrod V8's, they're very rev-dependent) leaves so little horsepower left that the acceleration is dismal. So of course, another debate of longer gears and 3-4 or shorter gears and using 3-4-5 at the track. This dispute is to be solved numerically, as quickly as I get done with chores and errands and finish rewriting my shiftpoint/gearing optimizing spreadsheet in C++ with increased precision, added air resistance and more gears.
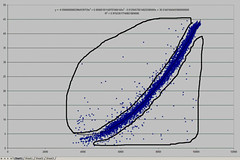
For now we just get to look at what it looks like in terms of air consumed at various speeds:
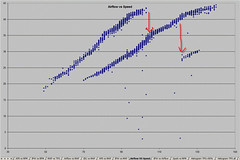
You can clearly see that after shifting to 5th, you only get 30lb/min of airflow, out of ~45 possible at higher revs. while normally this would be only a slight annoyance, at greater speeds it becomes absolutely detrimental.
Let's do a simple example: if at greater speed it takes you 150hp to just fight off the air resistance, and you have 450hp max, then you have 300hp left for actual acceleration. If you shift early and you're left making 300hp and still using 150hp to just cut through air, then you have 150hp left for acceleration. Combine that with taller gearing of 5th gear versus 4th, and you are effectively stuck with 1/3 of accelration you'd get in 4th!
And here's the biggest discovery of this datalog: I was watching Formula 1 the British Grand Prix from Silverstone, where with smaller engines these guys spend over 70% of the track going WOT!!! I never thought of measuring that, but now that I have the data, why not, right?
But of course, I tried to run this idea through some people, and they brought up a good point: how do you define the proportions? is it measured as:
- "wot acceleration"/"total number of samples"
- "wot acceleration"/"acceleration but not wot"
- "wot acceleration"/"number of samples in which car was not-braking"
I went with simple version and went with the first choice, as it provided me with what I think describes the issue best: how often around the track do we get to actually utilze the car's power to full potential?
I had few logs, and the results varied from about 19% to 22%.
Now this is LOW! And this is a very well suspensioned, well driven, light car on a lot of rubber! I expected a lot more, afterall this is a track with a pretty hefty straight (150mph+ max).
Some time ago on www.frrax.com (<--- awesome site, btw, if you haven't been there yet, go visit!) I did a quick calculations of how much does having extra 10hp on a 280average hp car help in actually decreasing times, and It came back with something suprisingly, yet laughably small, like 0.1 sec if we get to use that 10hp for 10 secs! So not only we dont get to use the extra power very often, but even when we do, it doesn't have that much influence.
So does adding power to amateur roadrace cars mostly increase chances of blowing up, and does next to nothing when it comes to actually reducing lap times?
posted by Marcin @ 5:24 AM
1 comments
![]()
![]()


1 Comments:
Marcin-
Great analysis.--Thank you! My car is more towards 2900 lbs. without driver. Temps were in the 85-95F range with 85%+ RH. The air filter was cleaned days before the track event. I'm curious as to why in later logs I'm seeing some 11.9X AFR's? You have to remember there were A LOT of cars on the track and I had to take 75% of my turns OFF-LINE AFTER A POINT-BY (have to wait....some are slow to give them) which may affect the WOT TP% a bit, but not too much. The car is much better than the driver, and I only had the 315s on for the 4th log. This was also my 1st time at Summit in about a year. I also realize that I short shift too much, like coming out of Turn 2 and Turn 9. I probably was shifting in the 5500-6000 range. Actually 2 cars out of the 50+ passed me (BMWCCA CR IP prepped E36, and an C-MOD? prepped E36 with a worked S54 E46 M3 motor....heard that had 400+HP and about 2400 lbs.?
"So does adding power to amateur roadrace cars mostly increase chances of blowing up, and does next to nothing when it comes to actually reducing lap times?"
Ummmm....probably for ameteurs like me. No, it helps but not as much as you'd imagine it to. Momentum is key, and even if you lose your momentum with 450hp, it takes time to get it back.
-Dennis
Oh, and what kind of aero do I have? I wouldn't consider my car too aero enhanced with an LG spoiler, windows down (parachute), and two 6" brake ducts attached to my front air dam
Post a Comment
<< Home